Read profiling in each family
Read profiling refers to the analysis of read profiles, which are represented by the distribution of positional read coverage and the read length distribution in annotation family. If the GROUP_READ option is activated, for each annotation family, we will compute and plot two types of read profiles, by using abundant and distinct reads respectively, or else only read profiles based on abundant reads will be investigated.
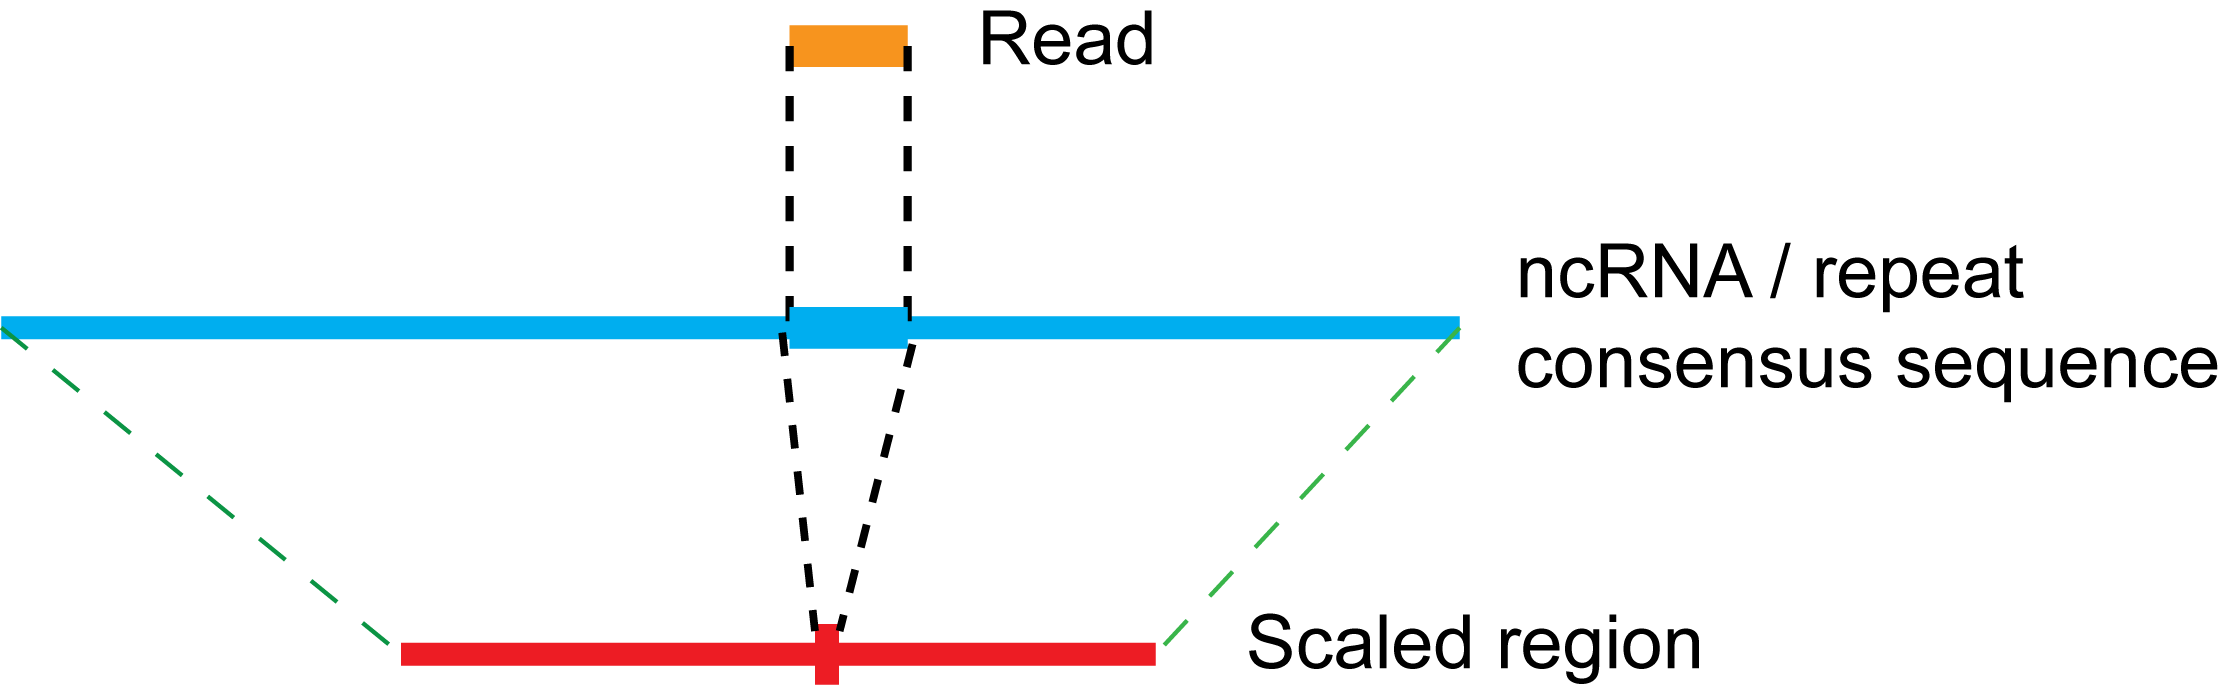
In read profiles, three types of read coverage distribution, which are generated based on 5' end, 3' end and all positions of reads respectively, are displayed together to have a clear view of the biogenesis of small RNAs. Since annotated features belonging to the same single family might have different full length, we use a scaling strategy as shown in Figure 10 to transform read positions in annotated items to corresponding positions in the scaled region. Using this strategy, we are able to sum up positional read coverages from different annotated features in a family, which are then normalized by the number of occurences of each feature position in the genome to obtain the average positional read coverage distribution. For repeat families, additional process is applied before the scaling step that is to locate the annotated repeat regions to the consensus sequence of its family, since repeats from some family like L1 in mouse are always truncated in the genome. Note that the occurrence of read is normalized by the total number of either mapped abundant reads or mapped distinct reads to RPM (reads per million mapped reads) depending on the type of read profiles. We then plot the average read coverage distribution in the scaled region, and number the X-axis according to the median size of annotated items in the family.
In each type of read profiles, relative length distributions of reads mapped in the sense, antisense and both direction of annotation family are plotted.
Figure 10:
The scaling process
|
|
Chongjian Chen
2012-01-26